
1. Update the following configuration in kibana.yml, located in C:\kibana\config.
YAML
server.host: "0.0.0.0"
server.port: 5601

elasticsearch.hosts: ["https://<host_ip>:9200"]

elasticsearch.username: "kibana_system"
elasticsearch.password: "<password>"

elasticsearch.ssl.verificationMode: certificate

elasticsearch.ssl.certificateAuthorities: ["C:/ELK/elasticsearch-9.2.0/config/certs/ca.crt"]
Replace <host_ip> with the configured Elasticsearch server IP and <password> with the value generated during the kibana_system password reset.
-
Open PowerShell as administrator from
C:\kibana\binand enter the following command to start Kibana:
.\kibana.bat
Kibana may take several minutes to fully initialize (often 5–10 minutes, depending on system performance).
-
Kibana startup can be verified with the following logs:
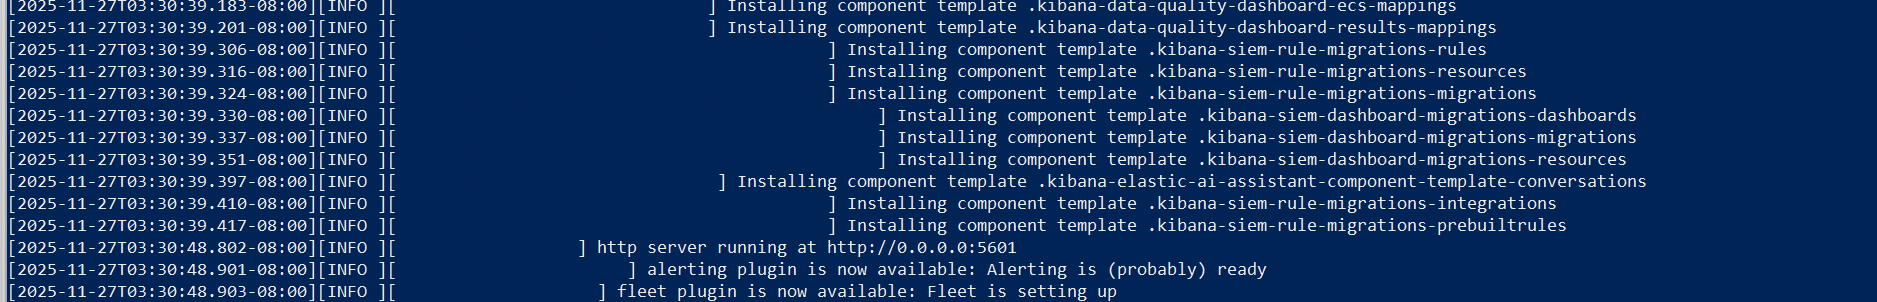
Verify Kibana startup
-
Open a browser and access http://<localhost>:5601 or http://<host_ip>:5601 to access the Elasticsearch dashboard and enter the configured superuser credentials to log in.
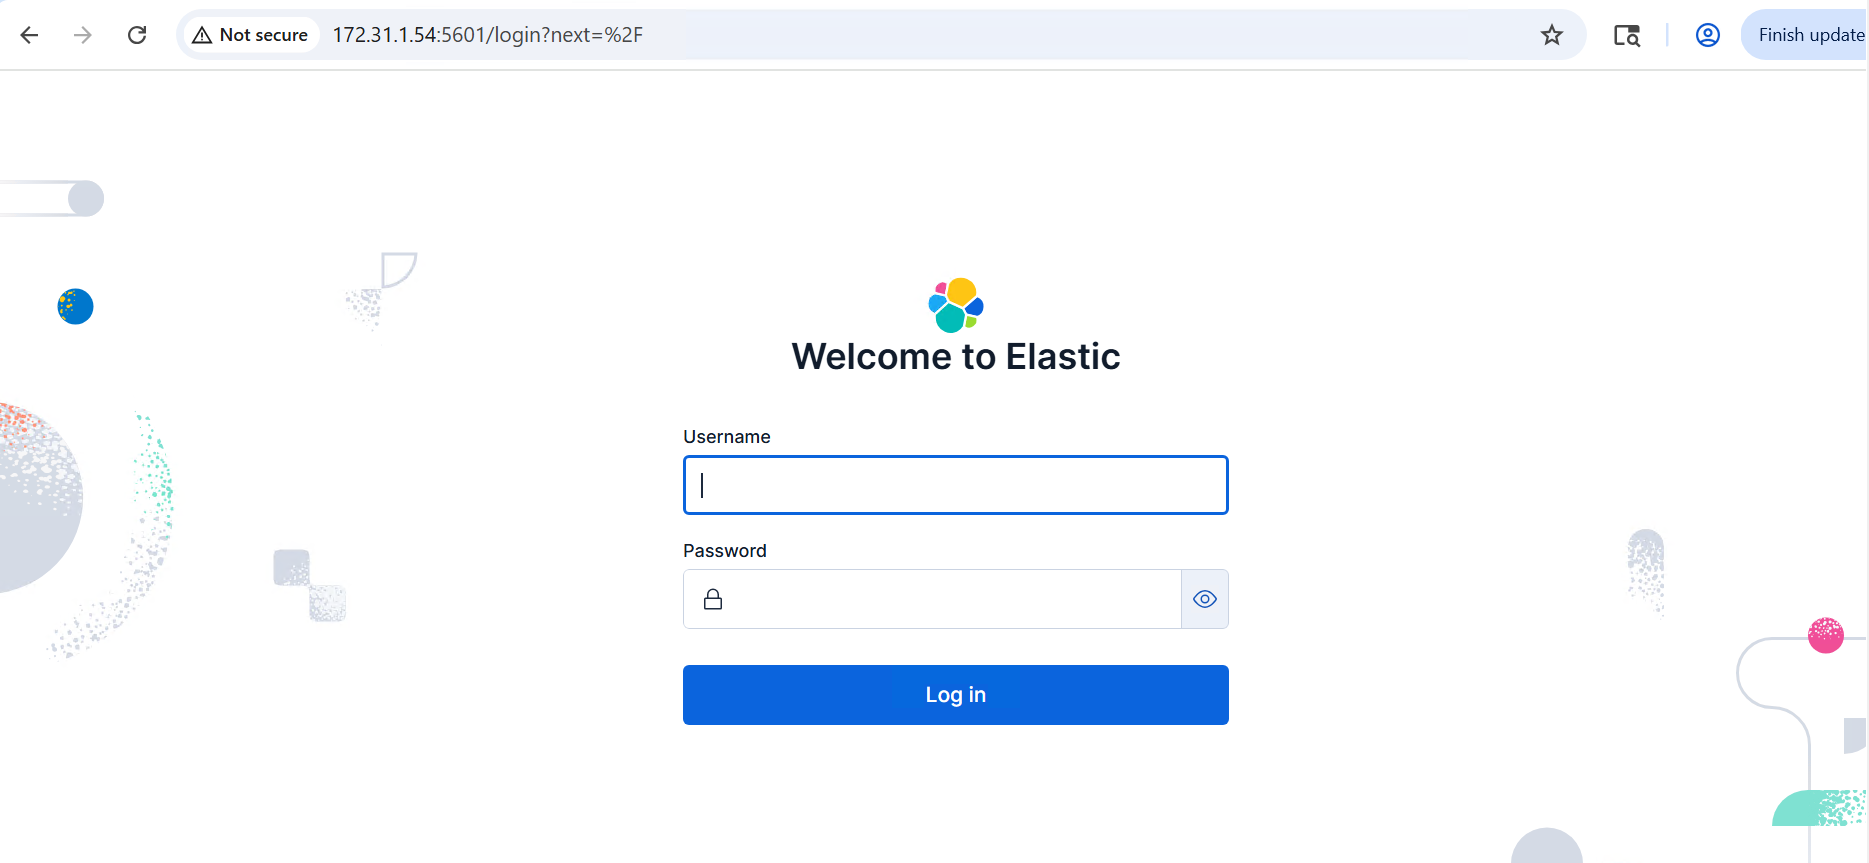
Elasticsearch dashboard