
-
Click the Device tab and click the Log Configuration link under the Logs & Statistics section.
-
Click the Edit button under the Syslog Settings table.
-
Select the checkboxes under the Enable Syslog column for the logs that need to be displayed in Elasticsearch.
-
Enter the machine IP where Elasticsearch / Elastic Stack is installed in the Syslog Server #1 IP column and enter port number 6514 in the Syslog Server #1 Port column.
-
Click the Save button.
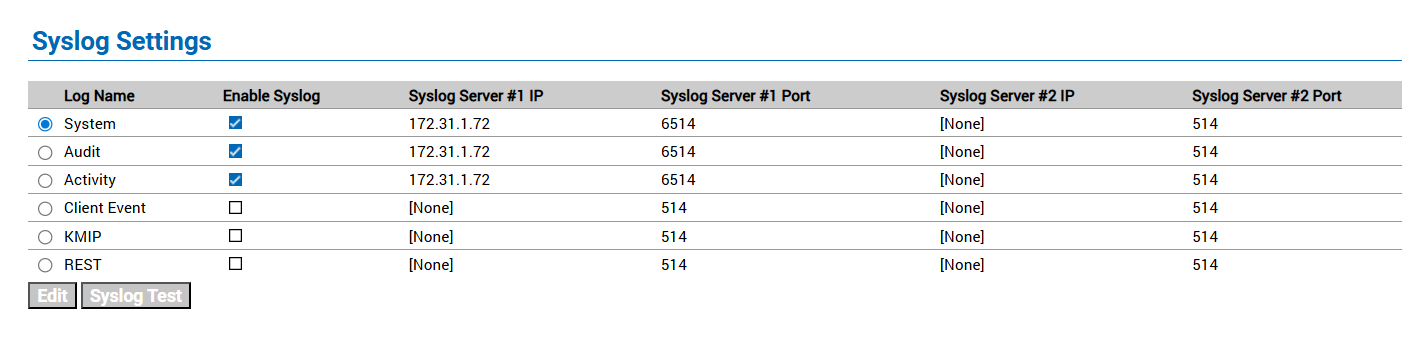
Syslog Settings
-
Click the Edit button in the Syslog TLS Settings section.
-
Enable the Enable TLS checkbox.
-
Select the uploaded client certificate name from the Certificate dropdown list.
-
Select the uploaded CA from the Trusted Certificate Authority dropdown list.
-
Click the Save button.
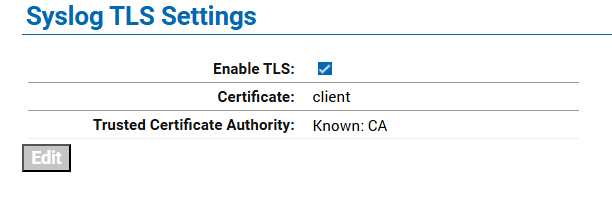
Syslog TLS Settings
-
Click on the Syslog Test button in the Syslog Settings section.
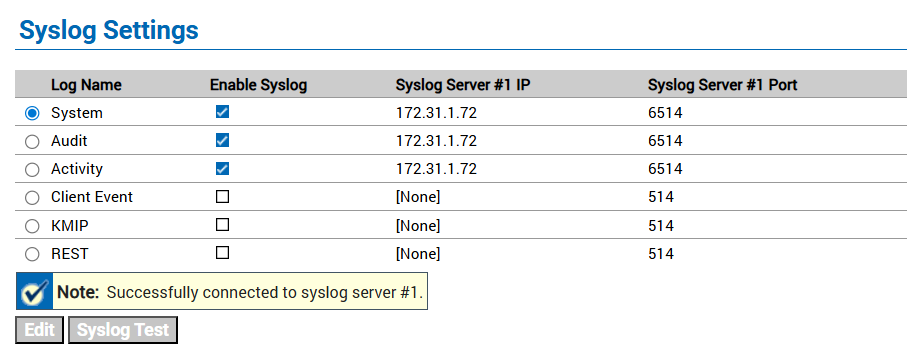
Syslog server connection confirmation message
-
Log out from the ESKM Web UI and log in again.
-
Click the Device tab and click the Log Viewer link under the Logs & Statistics section.
-
Click on the Audit link under the Log Viewer section and note down the latest logs displayed under Log File: Current.
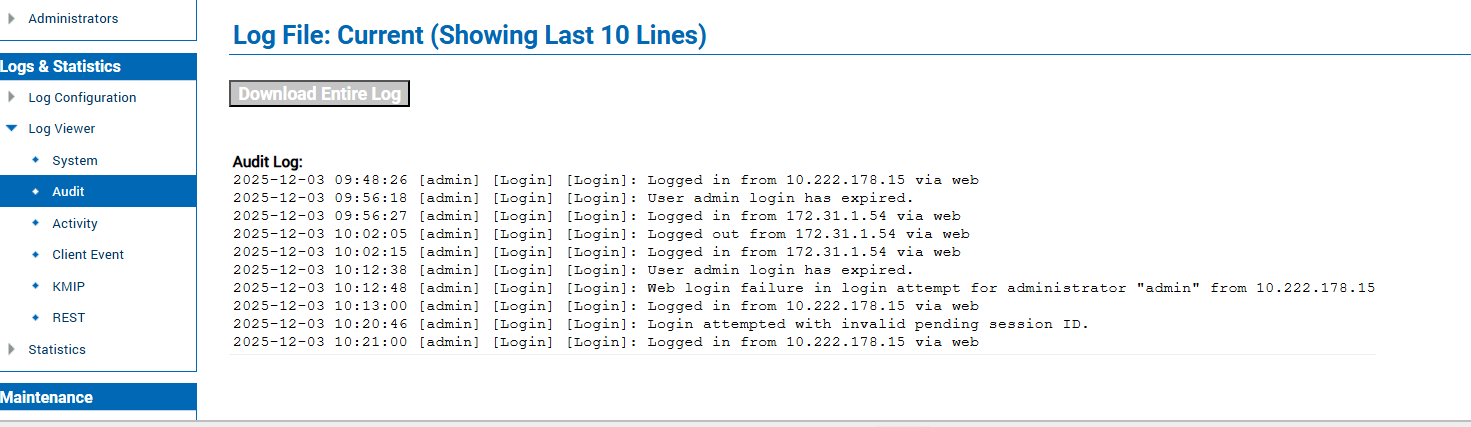
Audit log details