
-
Log in to the Windows machine where Elasticsearch is configured.
-
Open a browser and access http://<localhost>:5601 or http://<host_ip>:5601 to access the Elasticsearch dashboard and enter the configured superuser credentials to log in.
-
From the dashboard, navigate to Analytics → Discover.
-
Click the down-arrow on the right side of the Data View field, then click the Create a data view link.
-
Indexes will be displayed on the right panel; enter the created index (given in logstash.conf) in the Index pattern field. Enter the Name, and click the Save data view to Kibana button.
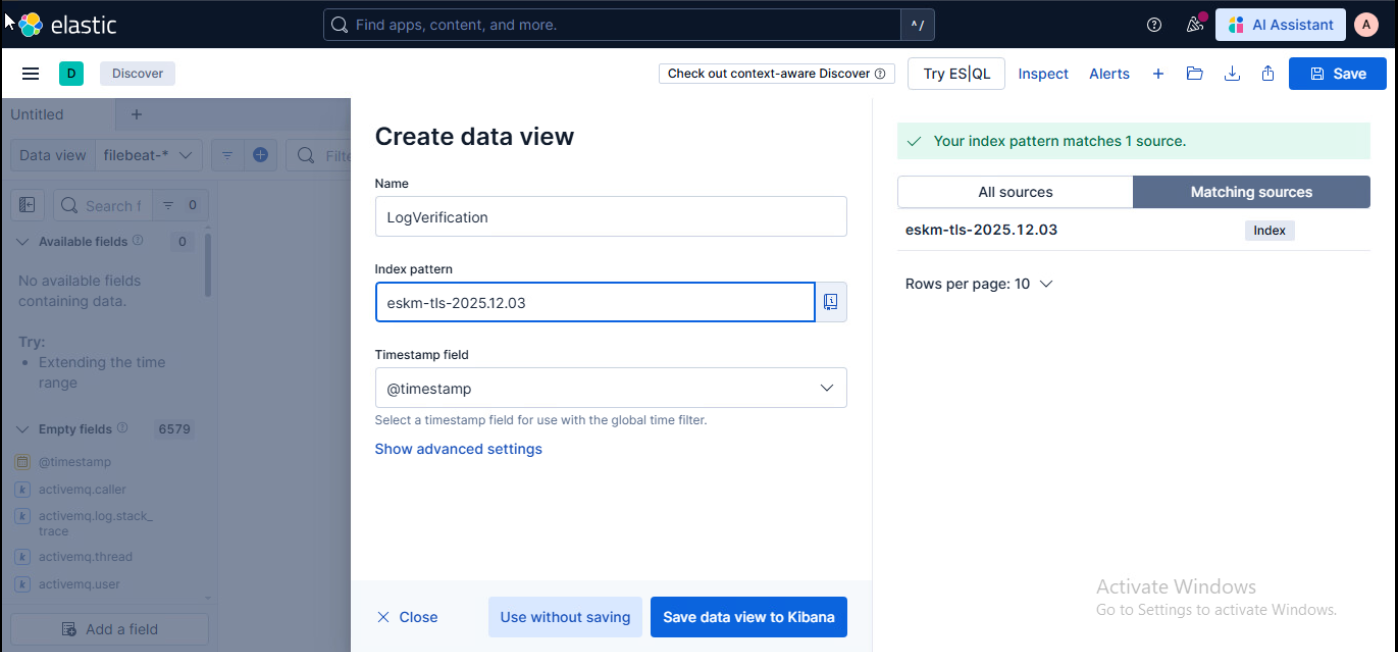
Create data view
-
ESKM log details will be displayed.
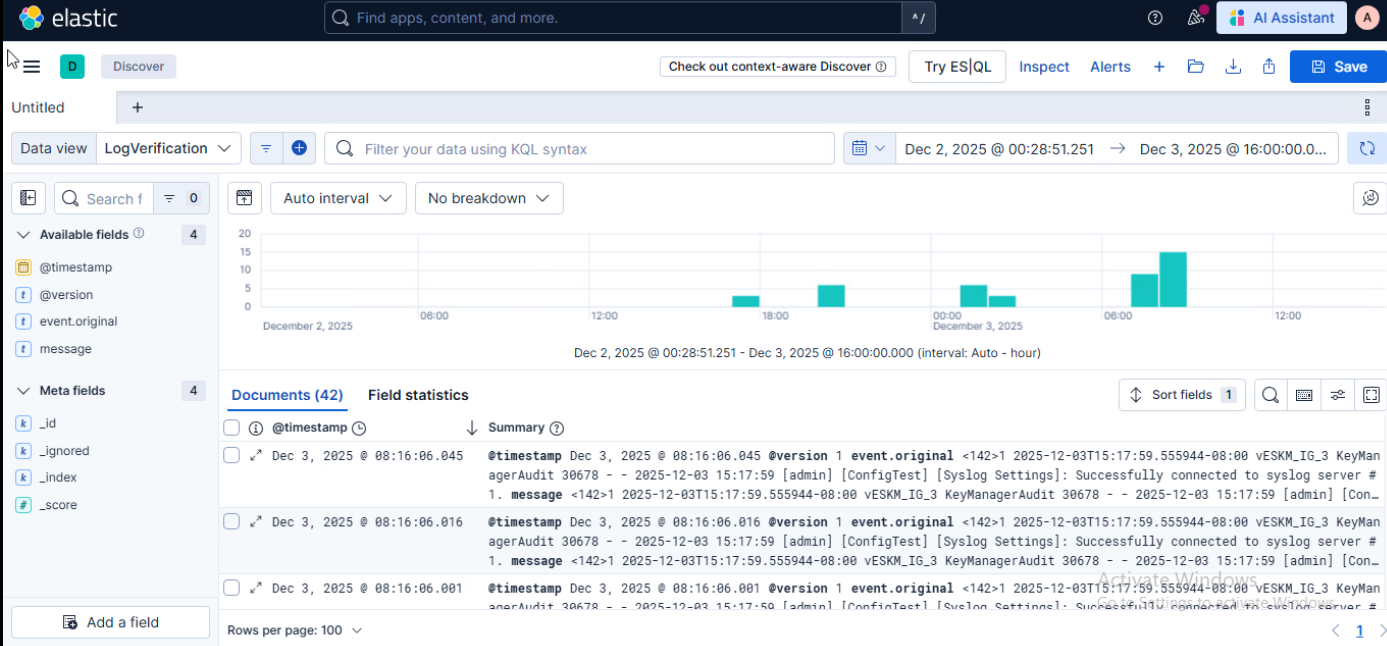
ESKM logs displayed in Elasticsearch
-
Click the Refresh button next to the date field to refresh and view the latest logs.
Modify the date or time range in the Start Date or End Date fields to display additional logs.